Exploring Water Availability Predictions with Reservoir Storage Time Series
This blog post touches on predicting water availability using Global Water Watch storage data. This is the result of a collaborative effort between Delft University of Technology, Deltares, and the Red Cross 510.

Emie Klein Holkenborg
Data & Information Manager,Red Cross
This blog post touches on predicting water availability using Global Water Watch storage data. This is the result of a collaborative effort between Delft University of Technology, Deltares, and the Red Cross 510 and originates from the Civil Engineering Master's thesis of Emie Klein Holkenborg (Klein Holkenborg, 2023). Our focus is to discover the functionalities of Global Water Watch, which provides open access to crucial water data, encompassing surface water and, soon, storage data. The research discussed leverages Global Water Watch’s extensive dataset to develop and test prediction models that can enhance our understanding of water availability dynamics in reservoirs.
Why Predicting Water Availability Matters
Let's begin by understanding the significance of predicting water availability. Small to medium-sized freshwater reservoirs play a vital role in fulfilling diverse needs, ranging from drinking water supply and facilitating hydropower generation, to supporting irrigation in countries all around the world. However, many of these essential water sources are vulnerable to the adverse effects of prolonged droughts, leading to potential societal crises. The notorious "Day Zero" in Cape Town, where the conditions almost lead to zero water availability for the city, serves as a stark reminder of the societal consequences that can arise when reservoirs face depletion (see previous blog).
To address such challenges effectively, it is crucial for decision-makers to have access to timely and accurate information about water resource shortages. Unfortunately, in some cases obtaining reliable reservoir data can be a daunting task due to restricted information sharing among stakeholders or data accessibility issues. It is here that Global Water Watch provides as a valuable solution. By providing surface water data and soon extending to storage data through the GWW API, this platform provides near real-time, open source information on water availability in small to medium-sized reservoirs worldwide, which could be used to enable decision making processes and to take timely and effective actions.
A Step Towards Availability Predictions
Volumetric storage data could be pertinent in certain scenarios for decision making. It will add another layer of information on top of the surface water area measurements as it will actually inform on the absolute extend of the water body. the transformation of surface measurements into storage volumes holds significance. For instance, during dry spells, it aids in determining whether the reservoir that provides water to a city contains an adequate buffer to continue supply. Global Water Watch presents two methods to accomplish this transformation. By making use of the open-access API provided by Global Water Watch, you are now able to apply the methodology to estimate water volumes within the reservoir you are focusing on .
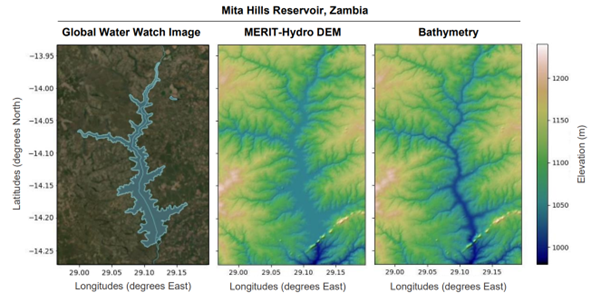
One of the employed methodology involves the reconstruction of reservoir bathymetry, achieved by interpolating the submerged landscape utilizing the MERIT-Hydro digital elevation model, HydroMT, and stream flow techniques, as outlined by Eilander et al. (2023). This process is further complemented by insights from the research conducted by Messager et al. (2016). An example of the reconstructed bathymetry for the Zambian reservoir ‘Mita Hills’ is illustrated in Figure 1.This innovative strategy allows for the conversion of reservoir area time series data into corresponding volume time series information. For further details, you can refer to Chapter 3.1 of the thesis document.
The volume time series obtained for the targeted reservoir holds potential for predicting water storage availability. You have the flexibility to conceptualize and create a model that suits your preferences in terms of complexity. To inspire your approach, let's delve into a case study from Klein Holkenborg's thesis (2019). In that work, a basic water availability prediction was crafted using multi-linear regression models. Furthermore, this approach was contrasted with an additional forecast obtained through the application of an autoregression model. These models delved into diverse predictor combinations that show correlation with the reservoir time series, particularly exploring the interplay between volume and SPEI (Standardized Precipitation Evapotranspiration Index) by Beguería et al. (2021) as well as volume and ERA5 precipitation by Hersbach (2011).
The results demonstrate that incorporating the SPEI, in particular, enhances the predictive capability of the model. The model successfully identified periods when water storage tended to be drier compared to historical averages during the given period. For the Hawane reservoir in Eswatini and the Katse Dam in Lesotho, the model was used to predict water storages falling below 1 and 0.5 standard deviation for a given month. To assess prediction quality, the Heidke Skill Score was employed to gauge accuracy in predicting this specified threshold. Results are shown in Figure 2. Notably, the SPEI in combination with the reservoirs' volume time series demonstrated improved predictive abilities compared to sole use of autoregression. However, this enhancement was not consistent across all reservoirs For certain reservoirs, the lagged correlation with SPEI was absent, particularly when the reservoir was managed at specific operating levels. Consequently, this shows, that the SPEI could only serve as a reliable indicator within the model framework for certain cases showing lagged correlation.
In conclusion, by leveraging the provided Global Water Watch volumetric data and the methodologies presented in this thesis, initial steps were taken towards predicting water storages in reservoirs. The Global Water Watch data, to be downloaded from the map or via the API, offers the possibility to explore such models for your own use of interest. Hopefully this served as a spark of inspiration for you to exploring water storages in reservoirs, ultimately enhancing decision-making processes!
If you have any related questions, please feel free to get in touch.
Emie Klein Holkenborg
MSc. Water Management – Delft University of Technology
Scientific committee:
Dr.ir. H.C. (Hessel) Winsemius – Deltares
Prof. dr. ir. R. (Remko) Uijlenhoet – Delft University of Technology
Prof. dr. ir. T. (Tina) Comes – Delft University of Technology
Dr. M.J.C. (Marc) van den Homberg – Red Cross 510
Figure 1
Figure 1: Three images providing a top view for Mita Hills reservoir in Zambia. On the left, the shape of reservoir within its region is provided, a screenshot of Global Water Watch by Donchyts et al. (2016). In the middle shows the land elevations prior to the bathymetry reconstruction provided by the MERIT-Hydro Digital Elevation Model accessed through HydroMT (Eilander et al., 2023). Here, the z-axis represents elevation in meters as indicated by the colorbar ranging from 900 to 1400 meters. The right image indicates the elevations as a result of the bathymetry reconstruction based on the MERIT-Hydro DEM, including a similar z-axis. The bathymetry is obtained for each cell representing the water surface using the “bathymetry method” as discussed in Klein Holkenborg (2023). In all images, the y- and x-axes represent latitude and longitude, respectively. This is an copy of Figure 4.7 in Klein Holkenborg (2023).
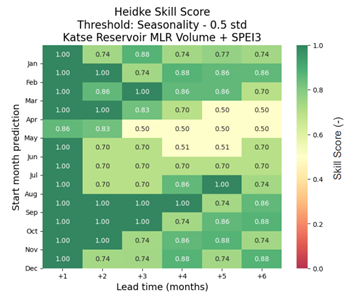
Figure 2
Figure 2: This matrix shows the Heidke Skill Score (HSS), which shows the performance of the model in predicting whether the true storage values deviate from the seasonality by 0.5 standard deviations (std) in a multi-linear regression (MLR) model with volume time series and time series of the 3 month average Standardized Precipitation and Evaporation Index (SPEI). The y-axis displays the starting month for each prediction, while the x-axis represents the lead time up to which the prediction is made. The HSS scores are color-coded to indicate performance, with green indicating relatively good performance (> 0.6) and red indicating poor performance (> 0.4).
References:
Donchyts, G., Winsemius, H., Baart, F. et al. High-resolution surface water dynamics in Earth’s small and medium-sized reservoirs. Sci Rep 12, 13776 (2022). https://doi.org/10.1038/s41598-022-17074-6
Eilander, D., Boigontier, H., Bouaziz, L., Buitink, J., Couasnon, A., Dalmijn, B., . . . Verseveld, v. W. (2023). HydroMT: Automated and reproducible model building and analysis. The Journal of Open Source Software, 1-7.
Klein Holkenborg, E. A. M., Winsemius, H. C., Uijlenhoet, R., Comes, T., Van den Homberg, M. J. C. (2023). Master’s Thesis: Towards Water Availability Predictions with Earth-Observed Open Data in Man-Made Reservoirs Worldwide. Education repository of Delft University of Technology. http://resolver.tudelft.nl/uuid:ed4ba706-9efb-4c0a-8fbd-331accd99f5b
Messager, M. L., Lehner, B. L., Grill, G., Nedeva, I., & Schmitt, O. (2016). Estimating the volume and age of water stored in global lakes using a geo-statistical approach. Nature Communications. doi:10.1038/ncomms13603
Links:
· MSc. Thesis Emie Klein Holkenborg
· Day Zero
How Cape Town was saved from running out of water | Water | The Guardian
· Previous blog
Analyzing Cape Town's day zero with Global Water Watch's API
· API Global Water Watch
api.globalwaterwatch.earth
· SPEI
Index: SPEI, The Standardised Precipitation-Evapotranspiration Index (csic.es)